DIY Smart CO2 Monitor Part 3: WiFi, Prometheus, and Grafana
In Part 2 of our DIY Smart CO2 Monitor project, we successfully built a proof-of-concept (PoC) using an ESP32-S3, an SH1106 OLED display, a DHT11 sensor for temperature and humidity, and an SGP30 sensor for CO2 and TVOC levels. We also got our first taste of coding with GitHub Copilot. Now, in Part 3, we’ll take a significant leap forward by connecting our ESP32 to WiFi, exposing the collected air quality data in Prometheus format, and setting up Prometheus and Grafana with Docker Compose for long-term data storage and visualization.
WiFi Station Mode and HTTP Server Implementation
Getting our ESP32 online involves several key components working together. Let’s break down the implementation based on our actual code:
WiFi Initialization and Connection
The ESP32 connects to WiFi in station mode (WIFI_MODE_STA) using the ESP-IDF framework. Our implementation includes:
- NVS Flash Initialization: Required for storing WiFi configuration data
- Network Interface Setup: Initialize TCP/IP adapter and create default WiFi station interface
- Event Handler Registration: Handle WiFi events like connection success, disconnection, and IP assignment
- WiFi Configuration: Set SSID, password, and security mode (WPA2-PSK)
Event-Driven WiFi Management
Our WiFi event handler manages the connection lifecycle and provides user feedback through the OLED display:
WIFI_EVENT_STA_START: Automatically attempts connection when WiFi startsWIFI_EVENT_STA_DISCONNECTED: Handles reconnection attempts on connection failureIP_EVENT_STA_GOT_IP: Displays the assigned IP address on the OLED screen
This event-driven approach ensures robust connectivity with automatic reconnection.
HTTP Server with Prometheus Endpoint
Once connected to WiFi, we start an HTTP server using ESP-IDF’s esp_http_server component. The server runs on the default port 80 and registers a single endpoint at /metrics that serves our sensor data in Prometheus format.
Thread-Safe Sensor Data Access
To ensure data consistency between the sensor reading loop and HTTP requests, we use a FreeRTOS mutex (sensor_mutex) to protect access to the shared sensor data structure. This prevents race conditions when the web server is serving metrics while sensors are being read.
Exposing Metrics in Prometheus Format
Prometheus is a popular open-source monitoring and alerting toolkit. It scrapes metrics from instrumented jobs, either directly or via an intermediary push gateway for short-lived jobs. For our ESP32, we’ll create an HTTP endpoint that Prometheus can scrape.
The Prometheus exposition format is text-based. Each metric has a help string (# HELP), a type string (# TYPE), and then the metric name with its value. Here’s an example of what our /metrics endpoint will output:
# HELP air_quality_co2_ppm CO2 concentration in parts per million
# TYPE air_quality_co2_ppm gauge
air_quality_co2_ppm 400
# HELP air_quality_tvoc_ppb Total Volatile Organic Compounds in parts per billion
# TYPE air_quality_tvoc_ppb gauge
air_quality_tvoc_ppb 142
# HELP air_quality_temperature_celsius Temperature in degrees Celsius
# TYPE air_quality_temperature_celsius gauge
air_quality_temperature_celsius 25.0
# HELP air_quality_humidity_percent Relative humidity percentage
# TYPE air_quality_humidity_percent gauge
air_quality_humidity_percent 38.0
# HELP air_quality_last_update_timestamp Unix timestamp of last sensor update
# TYPE air_quality_last_update_timestamp gauge
air_quality_last_update_timestamp 80732
When a request comes to http://<esp32_ip_address>/metrics, our ESP32 will read the latest sensor values, format them as shown above, and send them back as the HTTP response.
Docker Compose for Prometheus and Grafana
To collect, store, and visualize this data, we’ll use Prometheus and Grafana. Docker Compose is an excellent tool for defining and running multi-container Docker applications. Here’s a simplified docker-compose.yml to get Prometheus and Grafana running:
version: '3.8'

services:
  prometheus:
    image: prom/prometheus:latest
    container_name: prometheus
    ports:
      - "9090:9090"
    volumes:
      - ./prometheus:/etc/prometheus/
      - prometheus_data:/prometheus
    command:
      - '--config.file=/etc/prometheus/prometheus.yml'
      - '--storage.tsdb.path=/prometheus'
      - '--web.console.libraries=/usr/share/prometheus/console_libraries'
      - '--web.console.templates=/usr/share/prometheus/consoles'
    restart: unless-stopped

  grafana:
    image: grafana/grafana:latest
    container_name: grafana
    ports:
      - "3000:3000"
    volumes:
      - grafana_data:/var/lib/grafana
    depends_on:
      - prometheus
    restart: unless-stopped

volumes:
  prometheus_data: {}
  grafana_data: {}
You’ll also need a prometheus.yml configuration file (in a prometheus directory next to your docker-compose.yml) to tell Prometheus where to scrape metrics from. It would include a job definition for our ESP32:
global:
  scrape_interval: 15s # By default, scrape targets every 15 seconds.

scrape_configs:
  - job_name: 'esp32-air-quality'
    static_configs:
      - targets: ['<esp32_ip_address>:80'] # Replace <esp32_ip_address> with the actual IP
I run these Docker containers on my home NAS (Synology DS920+), which is a great way to have an always-on system for data collection and long-term storage. GitHub Copilot was a great help in drafting the initial ESP32 web server code and the Docker Compose configuration.
Visualizing the Data
Once Prometheus is scraping data from the ESP32, and Grafana is connected to Prometheus as a data source, you can create dashboards to visualize the air quality metrics over time.
Here’s a conceptual image of what the CO2 data might look like in Grafana:
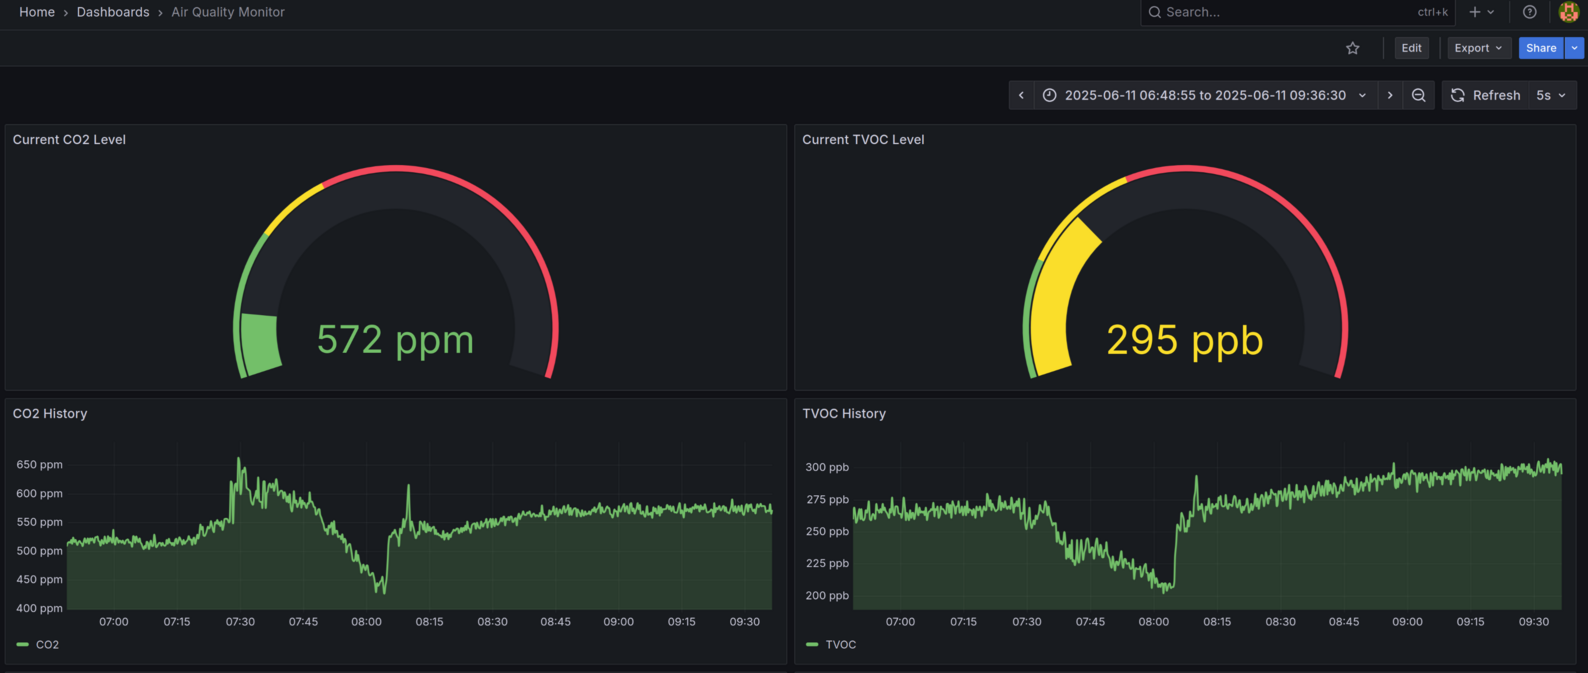
The data shows interesting trends. For example, when CO2 and TVOC values spike, opening a window causes the levels to drop significantly. Closing the window leads to the values rising again. This demonstrates that the relative changes are being captured effectively.
Next Steps: Improving Accuracy
While the relative values from the SGP30 are insightful, its absolute accuracy, especially for CO2, can be limited. For more precise measurements, the next step in this project will be to integrate a more accurate sensor. I plan to use the Sensirion SCD41, which uses an NDIR (Non-Dispersive Infrared) sensor to detect CO2, known for better accuracy.
Additionally, I’ll migrate the project to a more cost-effective ESP32 board for the final PoC before considering a “Stage 2” development, which might involve a custom PCB or a more refined enclosure.
Stay tuned for Part 4, where we’ll dive into integrating the SCD41 sensor and refining our hardware setup!