DIY Smart CO2 Monitor Part 2: Proof of Concept with ESP32-S3
Welcome back to the DIY Smart CO2 Monitor series! In Part 1: The Plan & Goals, I outlined my motivation and the overall roadmap for building a custom, smart CO2 monitor. Now, it’s time to dive into the first practical stage: the Proof of Concept (PoC).
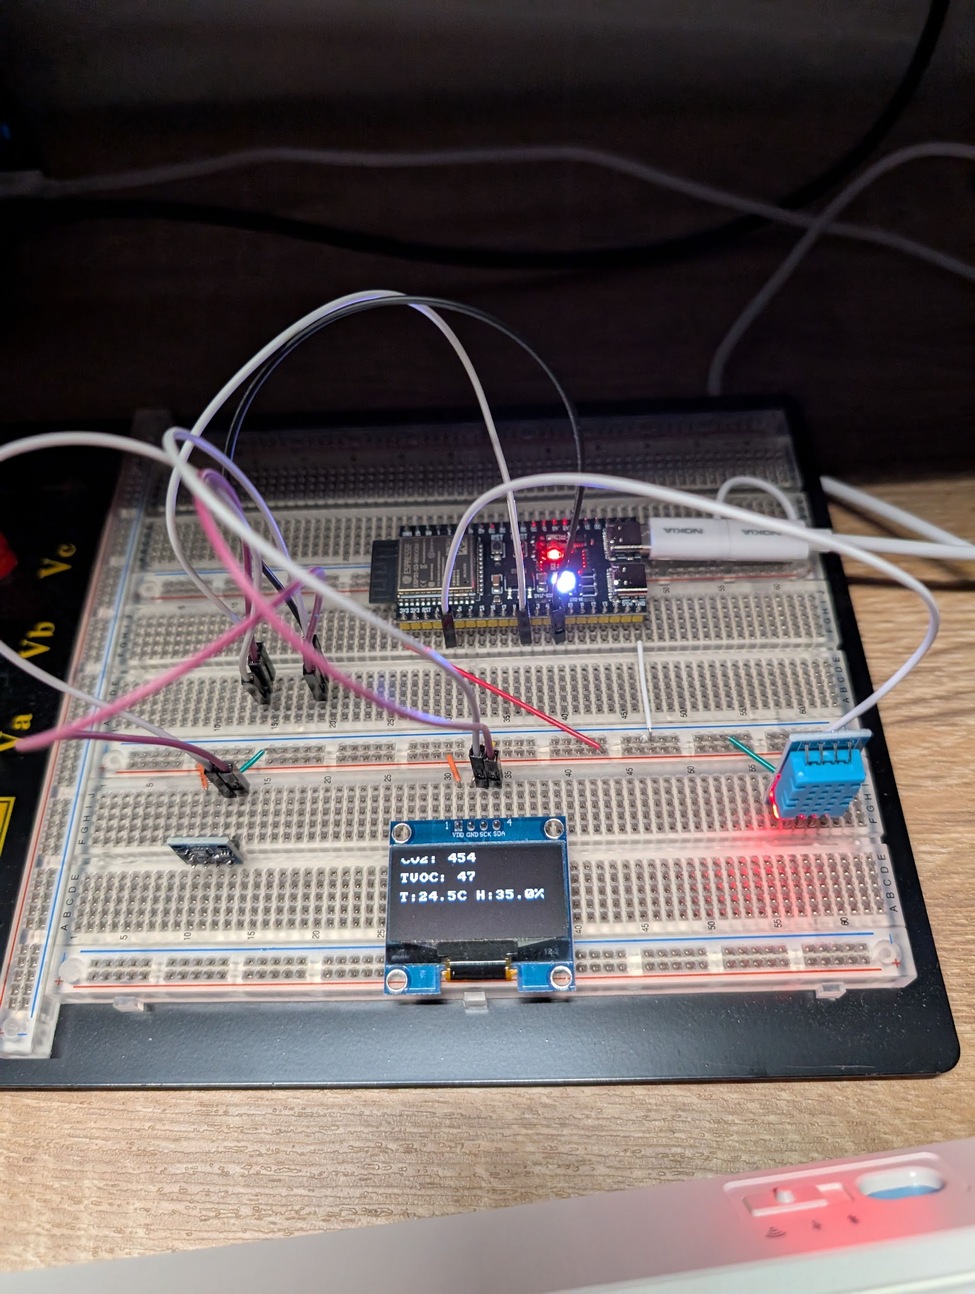
For this PoC, I assembled the core components on a breadboard to test functionality and get a feel for the sensors and the ESP32 platform.
Hardware Lineup for the PoC
Here’s a quick rundown of the components I used for this initial build:
- Microcontroller: ESP32-S3 Dev Board (approx. $10 USD)
- I opted for a higher-end ESP32-S3 for this PoC. While it’s a bit more powerful (and slightly more expensive) than strictly necessary for just a CO2 monitor, I chose it with future projects in mind that might demand more computational power or specific S3 features like AI acceleration capabilities or more I/O.
- The ESP32 family is quite diverse:
- Original ESP32: Still a workhorse, great for many IoT projects, very cost-effective.
- ESP32-S2: Single-core, focused on low power and security.
- ESP32-S3: Dual-core, adds AI instructions, more I/O, and Bluetooth 5 LE.
- ESP32-C series (C3, C5, C6 etc.): RISC-V based, often targeting specific cost points or connectivity needs (like Wi-Fi 6 in the C6).
- For later stages, especially if aiming for cost optimization in Stage Three (custom PCB), I’ll likely evaluate using a more basic ESP32 or an ESP32-C series chip to bring down the unit cost.
- Display: SH1106 OLED Display (1.3 inch) (approx. $4 USD)
- A crisp monochrome display to show CO2 levels, temperature, and humidity directly on the device.
- Temperature & Humidity Sensor: DHT11 (approx. $1 USD)
- A basic but widely available sensor to get ambient temperature and humidity readings. While not the most accurate, it’s sufficient for a PoC.
- CO2 & TVOC Sensor: Sensirion SGP30 (approx. $10 USD)
- This sensor provides CO2 equivalent (eCO2) and Total Volatile Organic Compound (TVOC) readings. It’s a good starting point for air quality sensing.
All these components were wired up on a standard breadboard for easy iteration.
Development Environment: ESP-IDF All the Way
Instead of using the Arduino extension for ESP32, I decided to set up and use the ESP-IDF (Espressif IoT Development Framework) directly.
- Pros of ESP-IDF:
- Direct Control: It provides much more direct access to the ESP32’s hardware features, FreeRTOS (the underlying real-time operating system), and low-level libraries.
- Latest Features: You often get access to the newest features and bug fixes from Espressif sooner.
- Optimization: More opportunities for fine-grained optimization of performance and memory usage.
- Official Framework: It’s the official development framework from Espressif.
- Cons of ESP-IDF:
- Steeper Learning Curve: Compared to Arduino’s simplified API, ESP-IDF can be more complex to get started with.
- More Boilerplate: Setting up projects and managing components can involve more configuration.
For a project where I want to understand the nuts and bolts and potentially build custom drivers, the control and flexibility offered by ESP-IDF felt like the right choice.
Peripheral Choices & I2C Simplicity
To practice working with the ESP32 and its peripherals, I selected the SH1106, DHT11, and SGP30. A key decision here was to primarily use sensors with an I2C interface.
- I2C (Inter-Integrated Circuit):
- Uses only two wires (SDA for data, SCL for clock) plus power and ground.
- Simpler wiring compared to SPI, especially when connecting multiple devices (as they can share the same bus, each with a unique address).
- Sufficient speed for many common sensors.
- SPI (Serial Peripheral Interface):
- Generally faster than I2C.
- Requires more wires (MOSI, MISO, SCLK, and a Chip Select for each device).
For this PoC, the simplicity and reduced wire clutter of I2C were ideal.
Coding with an AI Assistant: GitHub Copilot & Sonnet 3.5
A significant part of this PoC was leveraging AI for code generation. I used GitHub Copilot, powered by the Sonnet 3.5 model, extensively.
My experience was overwhelmingly positive:
- Rapid Prototyping: Copilot was excellent at generating initial boilerplate code for sensor initialization, reading data, and displaying it on the OLED.
- Iterative Refinement: While the first code suggestion wasn’t always perfect, the key was effective communication. By providing Copilot (running in an agent-like chat interface) with specific context, such as:
- Datasheets for the sensors (especially for communication protocols and register maps).
- Information about existing third-party device drivers in the ESP-IDF component registry.
- Clear descriptions of the desired logic. …I was able to guide it to produce working code after several iterations.
- Driver Generation from Scratch: One of the most impressive feats was generating a device driver for the SGP30 sensor from scratch. At the time, I couldn’t find a readily available ESP-IDF component for it in the Espressif Component Registry that fit my needs perfectly. So, armed with the SGP30 datasheet, I worked with Copilot to generate the I2C communication logic, data processing, and the necessary C code structure for an ESP-IDF component.
- Contributing Back: I was so pleased with the generated SGP30 driver that I packaged it as a proper ESP-IDF component and published it to the Espressif Component Registry! You can find it here: chiehmin/sgp30.
The PoC in Action!
After some tinkering and coding iterations, the breadboard setup came to life! The ESP32-S3 successfully read data from the DHT11 and SGP30, displaying CO2 (eCO2), TVOC, temperature, and humidity on the SH1106 OLED screen.
Here’s a picture of the final PoC setup:

Next Steps
This Proof of Concept (PoC) phase was a fantastic learning experience, especially in leveraging ESP-IDF and AI for development. The next step involves connecting the ESP32 to the internet and exposing its metrics, allowing other services to store historical data and generate graphs.